Showing posts with label nerd. Show all posts

2017-03-03

Airbox static flow CFD analysis


I did back to back testing on a rolling road with and without my Pipercross PX600 airbox. It turned out with the airbox fitted the engine lost almost 20 rear wheel horses! I desperately need to find a new solution to kill intake noise, and in order to do that I need a better understanding of what made the Pipercross airbox a bad performer.

On the rolling road we tested three scenarios. With airbox and filter, airbox without filter, and without airbox without filter. The filter did no difference what so ever, but with the airbox the difference was huge above 4000 rpm and up. We had problems with wheel slip on the rollers so the accuracy of the performance loss is low, but it is safe to say at least 15 rear wheel horses and probably more.

So CFD to the rescue. Or is it? This is not my home turf, this is me on a journey. I now know that this kind of static analysis is close to worthless. The difference will be huge in real life with valves opening and closing causing pulses that interfere with each other. I suspected that from the beginning but now I know for sure. I hesitated before publishing this post.

Anyway, I find this fun and interesting. And cool! But that's me. :-)

How I did the simulations

I used Autodesk CFD 2017 with the "old" solver. Advection scheme 1.

All simulations are made with a total flow of 420 cfm (ft^3/minute) on the supply port. (*)
An engine consume about 1.5 cfm per produced horse power [1] so a 280 hp engine requires 420 cfm of air.

I have set a pressure constraint of -28 in.H2O on all cylinder ports, and a flow volume constraint on the supply port. The idea is that all cylinders "suck" the same amount, and the cfm constraint will solve the pressure/velocity on the air supply port. Again, this is not my field of expertise, but I can't figure out a better way?

Then I run the simulation until convergence, run mesh adaption, and one more run until convergence. I used result planes with the bulk tool to calculate flow value results.

(*) I use these awkward units because that is what is commonly used in engine literature. At least the literature I've read.

PX600 airbox


First model is a rough model of my Pipercross PX600 airbox with a 90 deg silicon bend, as currently fitted to my car. As I wrote above, this box performed very badly on the rolling road test.

I started with a max flow simulation to see if the box suffocated the engine. It does not. It wouldn't surprise me if it could supply enough air for a Formula 1 engine. That is definitely not the problem.

Then I did the 420 cfm simulation as described above.


From left to right: 22%, 25%, 28%, 24% of air. If I recalculate this to air/fuel lambda it would be equal to: 0.74, 0.82, 0.93, 0.80, while the lambda sensor in the collector would read 0.82.

Here it is clear that the amount of air to each cylinder is not equal. If we don't use individual cylinder fuel trim the air to fuel ratio will be very different for each cylinder. That is not only killing performance, it could even be disastrous for a knock sensitive high compression engine! [2]

Second model is the same Pipercross PX600 airbox without the 90 deg silicon bend.

From left to right: 23%, 25%, 27%, 24% => lambda 0.77, 0.84, 0.89, 0.80.

A lot better. The silicon bend is not helping! But it is clear that the sharp turns into the trumpets are problematic.

R500 Caterham airbox


Third model is the R500 Caterham airbox. The measurements are just rough estimates taken from a few pictures I found on the internet and probably not very accurate.

From left to right: 32%, 23%, 22%, 23% => lambda 1.04, 0.76, 0.71, 0.77.

Nice looking box though. I do think my cad model could be improved and that could result in different results especially into first trumpet.

Own design #1


So I realized airbox design isn't easy. I figured I'd need more volume in order to slow the air down. I also realized that I could build a bigger air box if I was having the entry tube facing rearwards.

This is an attempt to slow the air down before the first trumpet, still withing the space constraints of my bonnet. I know, it isn't pretty.


From left to right: 27%, 25%, 23%, 24% => lambda 0.90, 0.83, 0.76, 0.79.

OK not bad, but still...

Own design #2


Next attempt was with smoother curves in an attempt to guide the air into first cylinder. Pretty nice looking if I may say!


From left to right: 29%, 25%, 24%, 22% => lambda 0.96, 0.82, 0.79, 0.72

That didn't work very well. Feeding an engine from the side is tricky business.

Conclusion

Again, a static flow analysis doesn't say anything. But one thing it shows very well is how difficult this is. In particular how hard it is to feed air to an engine from the side! I suspect that the only thing that works ok is individual fuel trim or air boxes with enormous volume.

I did a quick test with a transient simulation. Lets see if I follow up on that or if I spend my time on better things.

Sources:
[1] Engine Airflow, Harold Bettes, HPBooks
[2] Four-Stroke Performance Tuning, A. Graham Bell, Haynes

2016-03-15

Damper position sensors


I've written before - I have a thing for measuring things. I also have a new set of adjustable Penske dampers and wanted to see how their behaviour changes when turning those adjusters.

So, I've bought a pair of position sensors and made 3D printed suspension mounts for them. So far just for the rears but plan to do it all around.  They're wired into my data logger.
For reference - rear right.
The same five runs with Mid/mid setting.

Rear left, five runs with different settings.
I've made an attempt before with strain gauges on the pushrods. I'm looking forward to combine the two methods and see what that gives.

This weekend I got the chance to do a few test runs. I drove the same piece of road five times and adjusted the damper on the left rear between each run.

The X axis is the damper velocity (input voltage derived by time). The Y axis is the probability.

There are theories that the best suspension settings are when the diagram is symmetric around the zero. Regardless if you believe those theories or not, one can note that the rebound adjuster moves the curve sideways, and the compression adjuster mostly changes the peakiness of the curve. The Mid/Mid setting, which is the default setting from Penske, is very symmetric and that is probably a good sign?

The usefulness of this can be discussed but at least this gives me something to look at, as I don't trust my butt-dyno at all. 

2015-01-02

Airfoil behind roll cage CFD analysis


Does an airfoil generate downforce when placed behind a roll cage? Since I'm starting to get along with the CFD analysis software I did some more simulations.

The airfoil is a NACA 2312 at 160 km/h with 20° angle of attack. Length ~170 cm, width ~20 cm. As I suck on 3d modelling, none of the models correspond much with the real world. Neither the results probably, but can give an hint of what you could expect.

Without roll cage
Scenario 1 - No roll cage, airfoil 40 cm above trunk
Airfoil downforce: 791 N
Airfoil drag: 282 N
Total downforce: 1810 N
Total drag: 1230 N


40 cm
Scenario 2 - Airfoil 40 cm above trunk
Airfoil downforce: 542 N
Airfoil drag: 174 N
Total downforce: 1482 N
Total drag: 1296 N

50 cm
Scenario 3 - Airfoil 50 cm above trunk
Airfoil downforce: 857 N
Airfoil drag: 268 N
Total downforce: 1742 N
Total drag: 1438 N


Scenario 4 - No airfoil
Total downforce: 738 N
Total drag: 1051 N


Conclusion:

A wide airfoil behind the roll cage does generate downforce, but raising it just a bit increase the effect dramatically. To no surprise, the outer parts of the wing are the most effective regions. Real world experiments are necessary to find the optimal location.

2014-04-07

Aerodynamics - CFD simulations


After some vacation reading of the book "Race car aerodynamics" I have had lots of thoughts of how to improve the car's aerodynamics, especially the lack of down force.

The common approach on this subject is that the seven is a hopeless case and don't even bother. That might be true, or could it be the other way around? Since it does have the aerodynamic properties of a brick (or worse) - even small mods can make a great difference?

One problem is that you don't want to change the classic look of the seven. That is also true for a majority of seven owners. But I believed something like a flat underside could make a big difference. You can also add removable elements that you only have on the car when you're really going for it.

The question was, how much can be gained, and is it worth the effort?

Autocar did an article a long time ago (?) about wind tunnel testing of a Caterham. You can find it here:
#1 #2 #3

Some time ago I did some simple simulations of how much some downforce would affect lap time. The result was that 160N more downforce @100km/h would shorten the lap time with over a second! As a reference, F1 cars generate more than ten times of that, at the same speed. (source: the book mentioned.)

Wind tunnels are not accessible for most of us. At first I thought I would do road testing with string potentiometers measuring the suspension compression and connect it to the data logger. Straight roads are not that easy to find where I live, and going 200+ km/h on public roads are not that great either. The number of variables are endless and if something works or don't work I probably won't know why.

The book mentioned above briefly talks a bit about CFD - Computational fluid dynamics - and concludes that it is very expensive, complicated and not something for others than high end race teams. Well, time has passed since the writing of that book, and now the CFD software is not that hard to use and 30-days trials can be downloaded over the internet from many different software companies.

It turned out that the book was quite right. After experiments I now understand why top race teams still use wind tunnels. CFD simulation is very complicated, and it takes lots of effort to get accurate results. But for rough estimates it could still be very useful!

Baseline

So I made a rough simplified CAD model of my car. It may sound easy, but for a complete 3D modelling newbie it took quite a lot of time learning.

I started with high ambitions, but after a while I lowered them just to get some results at all. In these simulations the wheels are not rotating and the ground is not moving.


@160 km/h
257N front downforce
1935N drag

Note, these are rough numbers. 
I use to complain about front end lift when I drive, but this is pretty much the opposite. 

Anyway I plan to do some changes to the model and see how it affects the output. I also plan to investigate some individual parts in detail with finer meshes and higher accuracy.


2014-01-04

Oil temperature sender

I'm reading a book right now that among other things has a lot to say about oil. One of the things it says is:
"An engine should never be driven hard until the oil reaches 70°C". 
And later:
"In a race engine, bearing failure is a possibility any time the oil temperature goes past 130°C, and generally hp is lost over 115°C".

That is interesting. The first quote goes without saying but the second one makes me concerned of something I've neglected.

The CSR already has a 1-pol oil temperature sender on the oil return line from the dry sump pump, but it goes nowhere, at least on my car. Now when I have this fancy logger I can easily log the oil temperature and display it on my Dash.

As the sender is 1-pol I used a 2.2kΩ pullup resistor to the reference +5V. So far so good, now it only needs to be calibrated.

Right...

As I'd already done the wiring I thought I do it in the garage right next to the car. I put some engine oil in a stainless steel cup and heated it on my camping stove while watching the voltage on the dash and the oil temperature using a kitchen thermometer. The idea was that it would give me real world values despite all tolerances and the wire's resistance. The problems were that the oil temp sender did respond much slower on temperature changes than the thermometer. Also the temperature differed very much between different locations inside the cup. I ended up heating in steps of about 20°C and then waiting a few minutes until the temperature has settled before reading the voltage and temperature. (No, the smell of hot engine oil was not very pleasant). Maybe a better approach would be to measure the sensor's resistance in the oven instead.

°C Volt
11,7 3,260
37,6 1,882
57,7 1,070
79,2 0,600
97,7 0,358
116,5 0,204
136,5 0,126


I entered the values in the Analysis software that came with the logger and it gave me the formula:

-12,2 * x^3 + 74,2 * x^2 - 155 * x + 149

It is quite cool that the logger can calculate this real time and display it on my dash! But is it accurate?

Well not quite. It will give me a hint within maybe 5-10 °C and maybe that is enough. Regular interpolation would probably give better results. But why stop there?

Steinhart–Hart equation

(aka I got too much time because it is holidays and the children are sleeping)

The Steinhart–Hart equation is a model of the resistance of a semiconductor at different temperatures. The equation is:


After testing some different values I found that A=1,47E-3, B=2,40E-4 and C=8,77E-8 gave me a curve that looked more like my measured values.

Logarithmic chart of temp vs voltage.


Temp in °C = 1/(A+B*LN(R)+C*(LN(R))^3)-272,15
Where R = V*2200/(V-5)

So the final equation I use for my DL1 logger is:
1/(0,00147+0,00024*LN(-x*2200/(x-5))+0,0000000877*(LN(-x*2200/(x-5)))^3)-272,15

I think it works.

2013-09-09

Thermal camera


During the last F1 race they've equiped some of the cars with thermal cameras. How cool is that??

Notice how fast the tires cool on the straights, and how much heat is generated from just a small mistake. Some interesting words about it here. I also wrote something about wide tyres and heat a while ago, here.

Of course you'd want a camera like that yourself. The problem is that the price tag for an entry level thermal camera is several thousands of dollars.

There is soon a solution for that. Check out this camera that you attach to your smartphone. The estimated retail price is "just" $325!


2013-04-07

Does wider tyres equals more grip?

On a thread on Pistonheads someone claimed that wider tyres doesn't mean more grip.

Theoretically, the tyre size does not change grip as Amontons 2nd law states that friction force remains the same. The tyre size is really about matching width to the amount of energy being transferred to the ground, i.e. narrower tyres will run hotter.

Before I get shot down in flames, there are many other factors but the principle that a wider tyre will provide more grip is not necessarily the case unless you have the power to keep them warm.

I would say that the author of that comment is both right and wrong. The reasons why is far from obvious. I'm not an expert in any way but I do enjoy reading up on subjects that interest me. Race car rubber is one of them! But please take it for what it is.

Contact patch
Contrary to common belief the contact patch is not bigger with wider tyres, with the same internal pressure. The contact patch is calculated with area=load/pressure. With wider tyres the contact patch is obviously wider than with a narrow tire, but the area is the same.

Amontons 2nd law is tempting to use here, but rubber's friction is not that simple. Rubber generates friction in three different ways: adhesion, deformation, and wear. The generated friction force is not linear and very complicated.

Slip angle
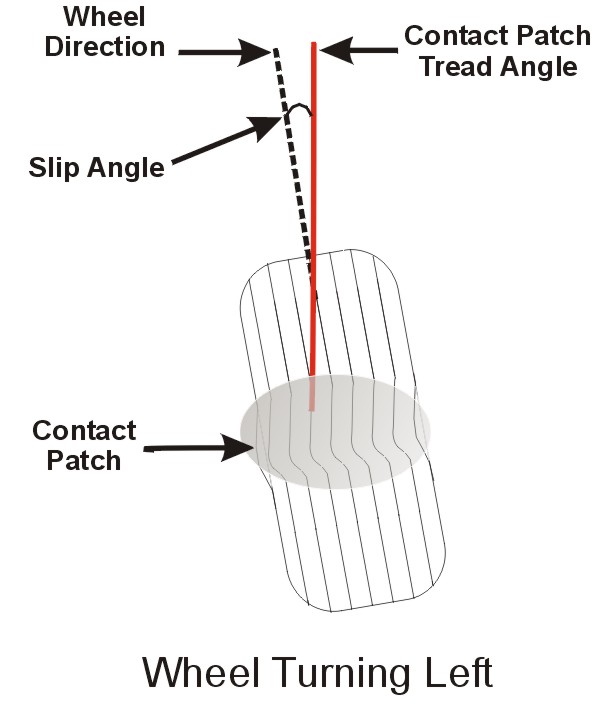
Slip angle is what generates grip, or to be more precise - lateral force. When a race car is cornering, the slip angle is the difference in what direction the tyres are pointing and the direction the car is heading. A race car generates maximum lateral force around 7-11 degrees of slip.

The term "slip angle" is a bit missleading, as with small slip angles there is no slip in the contact patch. In fact, it is the elastic nature of rubber that does the work here.

Lateral deformation in the contact patch
This is where the magic begins. The lateral force is generated by the tyres resistance to deflection. The deflection is not the same along the contact patch, but is built up gradually, non-linear.

So what is your point??
That wider tires do provide higher levels of lateral grip, because the wider contact patch leaves more room for the tyre to resist deflection. And resistance for deflection = force.

And heat?
More grip = more energy = heat. Too much of it means overheating, to little means cold tires. Wider tyres get warmer (not cooler) than narrow tires, because they generate more lateral force! They also cool faster than narrow tyres, because they have a larger surface area. And that is what makes it problematic.

Conclusion
Wider tyres = more grip in the corners. If you don't utilize the higher level of grip, they'll cool too much on the straights and they'll be outside of optimal temperature range.

Source and recommended reading:
The racing & high-performance tire - Paul Haney

When I wrote this post I sent an email to Paul to confirm a few thoughts. He wrote back to me within an hour - respect!

2012-08-23

OptimumLap simulation software

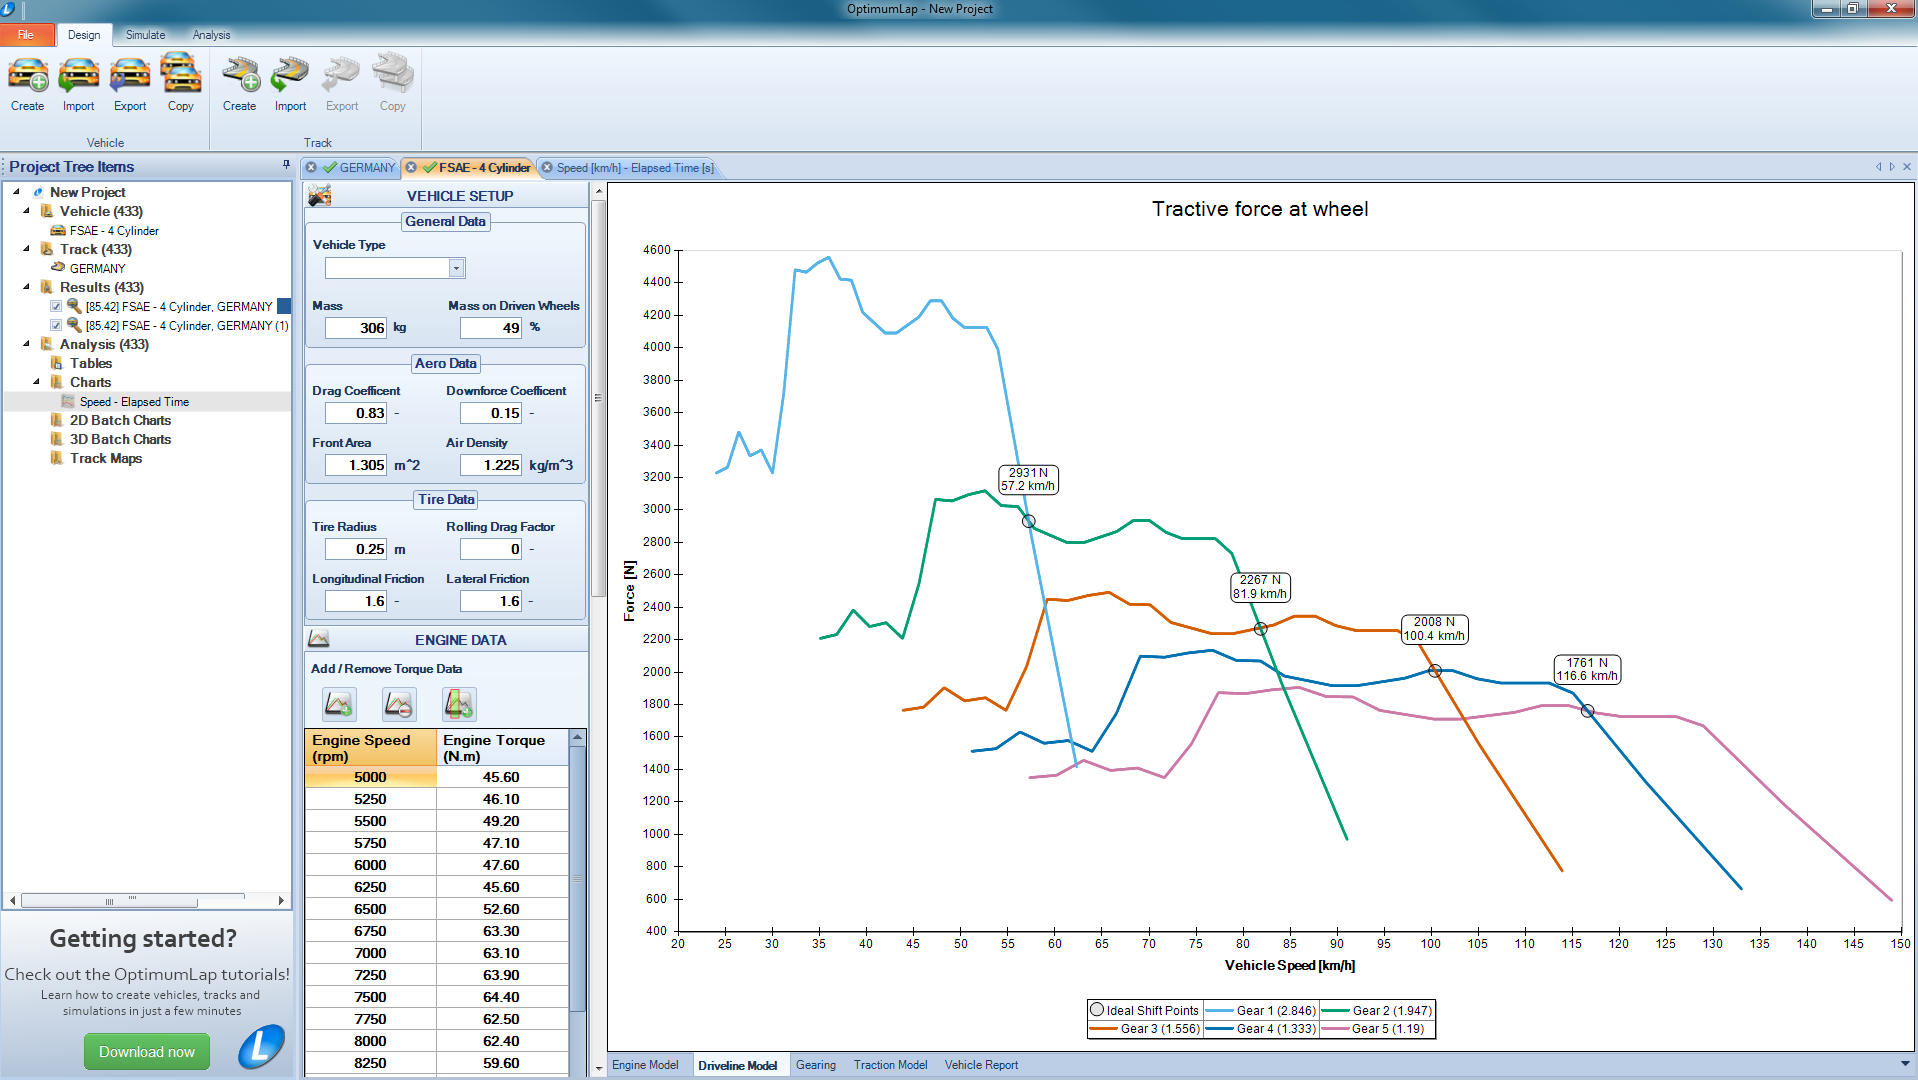
I got an invite to test a new software for simulation of how fast a car can run one lap on a race track, called OptimumLap. It uses a simplified model of how a car behaves on a race track, but according to the company, despite the simple model it gives results that are accurate within 10%.


I have only good things to say about the software, and if you get the chance I suggest that you should try it out. Atleast for me it was a bit of an eye opener.

In the software I constructed seven variations of my car, and run it in the simulator on two Swedish tracks. The simulated lap times was a bit from my real world actual lap times, but it is still very useful for finding out what changes to the car could make a significant improvement.


Mantorp - A wide track with a long straight and high average speed.

  1. Current setup: 85,72s
  2. 10% more tire grip: -2.43s
  3. 160N more downforce @100 km/h: -1.05s
  4. 10% more power at rear wheels: -0.80s
  5. 10% less drag: -0.28s
  6. 30 kg less weight: -0.26s
  7. All of the above: -5.66s

Gotland Ring - A very technical track with hills and cambered corners.

  1. Current setup: 83.81s (I wish...)
  2. 10% more tire grip: -1.55s
  3. 160N more downforce @100 km/h: -1.34s
  4. 10% more power at rear wheels: -0.31s
  5. 10% less drag: -0.19s
  6. 30 kg less weight: -0.04s
  7. All of the above: -4,60s


The results are quite interesting.
  • Tyre grip is very important, of course. No big news here.
  • Some extra horses would be nice on Mantorp, but expensive and 10% more hp is a lot.
  • Working on reducing drag is nice, but not that much to work on.
  • Reducing weight does almost nothing on Gotland Ring!
  • Adding downforce does a lot! Over a second on both tracks, that is really something that could be improved!
Adding downforce to a seven type car is almost as swearing in church, but what if it is a wing that could be removed when not on a track? I have no idea of how much downforce a wing could provide, but to me 160N at 100km/h doesn't sound completely unreasonable? Of course the drag would increase as well, but it would still be an easy and cost effective way to loose some lap time. I believe a front wing would be most beneficial since I use to experience some understeer on high speed corners, probably because of lift.

A quick Google search gave me this: Levante front wing 


I'll start looking for options...